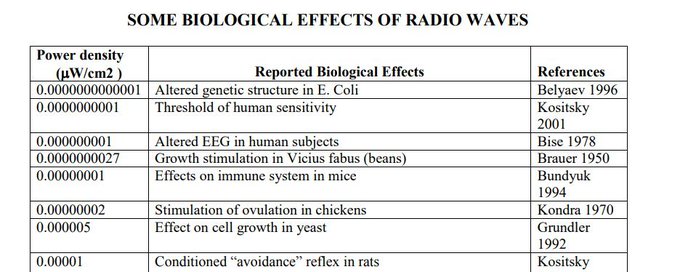
A quarter century ago, Arthur Firstenberg published a chart that tried to do something regulators still resist doing today: put reported biological effects and real-world exposure benchmarks into the same visual frame. In the August 2022 revision of Radio Wave Packet, that chart still opens the document, and it still makes the same core point. Reported biological effects do not begin at the FCC’s whole-body limit. They show up across a vast range of power densities, from vanishingly small levels all the way up to the far higher exposures produced by devices pressed against the body. On pages 2 and 3, the chart runs from 0.0000000000001 µW/cm² for altered genetic structure in E. coli all the way up to 20,000 µW/cm² for cell-phone-against-head exposure, while also placing common background comparisons in the same scale: 0.0004 µW/cm² at 100 yards from a home Wi-Fi router, 0.01 to 0.1 µW/cm² at one mile from a 2G/3G/4G cell tower, 1,000 µW/cm² as the FCC whole-body exposure limit, 17,000 µW/cm² for a wireless laptop on a lap, and 20,000 µW/cm² for a phone against the head.
What the chart got right, long before the current round of “high-certainty” reviews and risk modeling, was that the public had been trained to ask the wrong question. The thermal-only framework assumes that if a field does not dump enough energy into tissue to heat it, it must not matter much biologically. But the chart was never really about one magic number. It was about the pattern: genetic changes, EEG changes, immune effects, ovulation effects, plant injury, disturbed carbohydrate metabolism, calcium efflux, blood-brain barrier changes, altered white blood cell activity, sterility, cancer, and reproductive harms all appearing somewhere in the literature at levels that do not fit the simple “more heat = more harm” story.
That does not mean every row in the chart carries identical evidentiary weight. It is a curated historical packet, not a single modern meta-analysis. Some entries are animal experiments, some are plant studies, some are occupational observations, and some are ecological or distance-based comparisons. The honest way to read it is not as though each bullet is equivalent to a modern regulatory risk estimate. The honest way to read it is as an early-warning map showing that biological activity was being reported across many endpoints and many orders of magnitude below what the public was told to worry about.
And that is exactly why the chart feels so relevant again in 2026. The March 14, 2026 Environmental Health paper by Ronald L. Melnick and Joel M. Moskowitz did not argue that every old paper was perfect. It asked a narrower, far more devastating question: if modern public-health risk methods are applied to the strongest animal cancer and reproductive data, do today’s public limits look protective? Their answer was no. The paper’s abstract reports that the derived whole-body SAR associated with a 1 in 100,000 cancer risk is about 0.8 to 5 mW/kg, and the estimated protective whole-body SAR for male fertility is about 3.3 to 10 mW/kg. Both are well below the current public whole-body limit of 0.08 W/kg (80 mW/kg). The paper concludes that current public limits are 15- to 900-fold higher than the authors’ cancer-risk-based estimates, depending on daily exposure duration, and 8- to 24-fold higher than levels protective of male reproductive health.
That is why the simple advocacy line that current limits are “about 200 times too high” for cancer protection is not rhetorical fluff. It is a fair summary of one part of the paper’s modeling under common daily exposure assumptions. And the 24-times-too-high line for male fertility is not a slogan either. It comes directly from the reproductive-risk side of the same paper. In other words, the newest quantitative paper is not doing something radically different from what Firstenberg’s chart was doing in spirit. It is doing the same job with a stronger, more formal methodology: showing that the thermal-only framework leaves too much biology out of the picture.
The same convergence shows up in the recent WHO-linked review pipeline. Meike Mevissen and colleagues’ 2025 animal-cancer systematic review concluded with high certainty of evidence for malignant glioma and malignant schwannoma in male rats. The male-fertility review by Cordelli and colleagues was later corrected, and the 2025 corrigendum upgraded the key endpoint—reduced pregnancy rate after male RF exposure—to high certainty as well. Whatever arguments continue around individual methods, those are not trivial phrases. “High certainty” is the kind of language public-health institutions use when they no longer think the signal is easy to dismiss.
Where the tower issue becomes especially explosive is Ramazzini. In the transcript you supplied from Ronald Melnick’s video explanation, he says that when the Ramazzini Institute data are analyzed using power density—rather than SAR, which he said is not the best metric for that design—the cancer-risk estimate for 19-hour exposure comes out 4,200-fold below the FCC limit for cell towers. That point matters because it tightens the bridge between the older chart and the newer risk paper. Firstenberg’s chart placed 0.01 to 0.1 µW/cm² at one mile from a cell tower on the same page as reported biological effects at similarly low levels. A quarter century later, Melnick’s own description of the Ramazzini-based addendum reaches the same strategic destination from a different direction: tower-style exposures cannot be assumed safe merely because they sit below legacy limits.
The deeper lesson is that the chart was never really about proving one disease with one number. It was about exposing a structural error in how wireless safety had been framed. The packet itself says this explicitly in the later pages: it argues that “power level is irrelevant” in the simple toxicology sense, points to power windows, inverse dose-response behavior, calcium efflux findings, and the idea that the informational content of the signal—frequency, pulsation, waveform, modulation—may matter as much as or more than raw power alone. Whether one agrees with every conclusion in the packet or not, that framing is much closer to the modern non-thermal debate than the old “if it doesn’t heat, it doesn’t hurt” narrative ever was.
So what this chart really got at was not just that “effects happen at low levels.” It got at something more fundamental: biology does not behave like a brick in an oven. It behaves like a signaling system. That is why the same chart can place disturbed carbohydrate metabolism, altered EEGs, white blood cell changes, sterility, and cancers in one spectrum. The argument is not that all effects are equal. The argument is that once an exposure can perturb upstream signaling, different tissues and systems may fail in different ways. And that is precisely why the modern evidence is so damaging to the thermal-only model. The strongest new papers are not contradicting the old warning. They are quantifying it.
Full chart, rewritten as a readable bullet list
The bullet list below is a prose rendering of the full “Some Biological Effects of Radio Waves” chart from pages 2–3 of Radio Wave Packet.
- 0.0000000000001 µW/cm² — Altered genetic structure in E. coli (Belyaev 1996)
- 0.0000000001 µW/cm² — Threshold of human sensitivity (Kositsky 2001)
- 0.000000001 µW/cm² — Altered EEG in human subjects (Bise 1978)
- 0.0000000027 µW/cm² — Growth stimulation in Vicius fabus (beans) (Brauer 1950)
- 0.00000001 µW/cm² — Effects on immune system in mice (Bundyuk 1994)
- 0.00000002 µW/cm² — Stimulation of ovulation in chickens (Kondra 1970)
- 0.000005 µW/cm² — Effect on cell growth in yeast (Grundler 1992)
- 0.00001 µW/cm² — Conditioned “avoidance” reflex in rats (Kositsky 2001)
- 0.000024 µW/cm² — Premature aging of pine needles (Selga 1996)
- 0.000024 µW/cm² — Smaller tree growth rings (Balodis 1996)
- 0.0004 µW/cm² — Approximate exposure at 100 yards from a home Wi-Fi router
- 0.0017 µW/cm² — Decreased seed germination in pine trees (Selga 1996)
- 0.002 µW/cm² — Sleep disorders, abnormal blood pressure, nervousness, weakness, fatigue, limb pain, joint pain, digestive problems, and fewer schoolchildren promoted in a controlled study near a shortwave transmitter (Altpeter 1995, 1997)
- 0.0027 µW/cm² — Growth inhibition in Vicius fabus (beans) (Brauer 1950)
- 0.004 µW/cm² — Approximate exposure at 100 yards from a 2G, 3G, or 4G cell phone at peak power
- 0.01 µW/cm² — Approximate exposure at 100 yards from a commercial or outdoor Wi-Fi router
- 0.01 to 0.1 µW/cm² — Approximate exposure at 1 mile from a 2G, 3G, or 4G cell tower
- 0.06 µW/cm² — Altered EEG, disturbed carbohydrate metabolism, enlarged adrenals, altered adrenal hormone levels, and structural changes in liver, spleen, testes, and brain in white rats and rabbits (Dumanskij 1974)
- 0.06 µW/cm² — Slowing of the heart and change in EEG in rabbits (Serkyuk, reported in McRee 1980)
- 0.1 µW/cm² — Increase in melatonin in cows (Stark 1997)
- 0.1 to 1.8 µW/cm² — Decreased life span, impaired reproduction, and structural and developmental abnormalities in duckweed plants (Magone 1996)
- 0.13 µW/cm² — Decreased cell growth in human epithelial amnion cells (Kwee 1997)
- 0.168 µW/cm² — Irreversible sterility in mice (Magras 1997)
- 0.2 µW/cm² — Childhood leukemia up to 12 km from a TV tower (Hocking 1996)
- 0.3 µW/cm² — Impaired motor function, reaction time, memory, and attention in schoolchildren, plus altered sex ratio of children with fewer boys (Kolodynski 1996)
- 0.4 µW/cm² — Breakdown of the blood-brain barrier by cell phones (Eberhardt 2008)
- 0.6 µW/cm² — Change in calcium ion efflux from brain tissue (Dutta 1986)
- 0.6 µW/cm² — Cardiac arrhythmias and sometimes cardiac arrest in frogs (Frey 1968)
- 0 to 4 µW/cm² — Altered white blood cell activity in schoolchildren (Chiang 1989)
- 1 µW/cm² — Headache, dizziness, irritability, fatigue, weakness, insomnia, chest pain, difficulty breathing, and indigestion in humans under occupational exposure (Simonenko 1998)
- 1 µW/cm² — Stimulation of white cells in guinea pigs (Shandala 1978)
- 2 µW/cm² (lower threshold not known) — Auditory effects including clicking, buzzing, chirping, hissing, or high-pitched tones (Frey 1963, 1969, 1971, 1973, 1988; Justeson 1979; Olsen 1980; Wieske 1963; Lin 1978)
- 2 µW/cm² — Memory loss in rats exposed to cell phones (Nittby 2009)
- 5 µW/cm² — Leukemia, skin melanoma, and bladder cancer near TV and FM transmitters (Dolk 1997)
- 5 µW/cm² — Biochemical and histological changes in liver, heart, kidney, and brain tissue (Belokrinitskiy 1982)
- 8 µW/cm² — Exposure to head and chest from a wireless laptop on a table
- 10 µW/cm² — Damaged mitochondria and nucleus of cells in hippocampus of the brain (Belokrinitskiy 1982a)
- 10 µW/cm² — Impaired memory and visual reaction time in people living near transmitters (Chiang 1989)
- 10 µW/cm² — Decreased litter size and increased number of stillborns in mice (Il’Chevich, reported in McRee 1980)
- 10 µW/cm² — Redistribution of metals in lungs, brain, heart, liver, kidney, muscles, spleen, bones, skin, and blood (Shutenko 1981)
- 150 µW/cm² — Exposure to head and chest from any cell phone on a table
- 1,000 µW/cm² — FCC’s whole-body exposure limit
- 17,000 µW/cm² — Exposure to genitals from a wireless laptop on a lap (FCC 2018; Racini 2015)
- 20,000 µW/cm² — Exposure to brain from any cell phone against the head